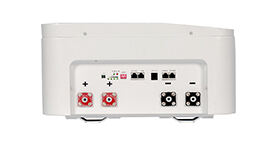
How to reasonably design the capacity ratio of photovoltaic stations
With the growing global demand for renewable energy, photovoltaic power generation technology has been rapidly developed. As the core carrier of photovoltaic power generation technology, the design rationality of photovoltaic power station directly affects the power generation efficiency, operation stability and economic benefits of the power station. Among them, the capacity ratio, as a key parameter in the design of photovoltaic power station, has an important impact on the overall performance of the power station. The purpose of this paper is to discuss how to rationally design the capacity ratio of photovoltaic power station to improve the power generation efficiency and economy.
01 Overview of photovoltaic station capacity ratio
The capacity ratio of photovoltaic station refers to the ratio of the installed capacity of photovoltaic modules to the capacity of inverter equipment.
Due to the instability of photovoltaic power generation and the reason that it is greatly affected by the environment, the capacity ratio of photovoltaic stations simply according to the installed capacity of photovoltaic modules 1:1 configuration will cause photovoltaic inverter capacity waste, so the photovoltaic system power generation efficiency is improved under the premise of stable operation of the photovoltaic system, the optimal capacity ratio design should be greater than 1:1. Rational capacity ratio design can not only maximize the power output, but also adapt to different lighting conditions and cope with some system losses.
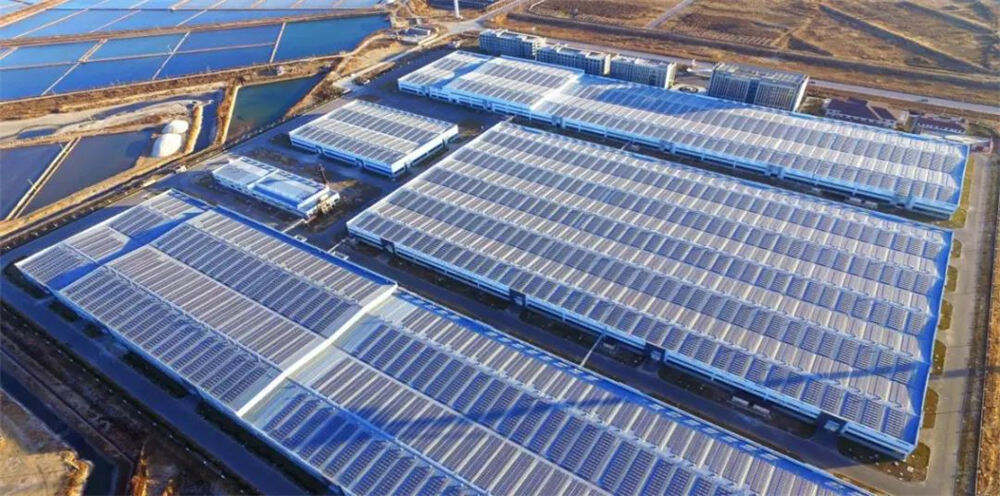
02 Main influencing factors of volume ratio
Reasonable capacity ratio design needs to be comprehensively considered according to the specific project situation. Factors affecting capacity ratio include component attenuation, system loss, irradiance, component installation Angle, etc. Specific analysis is as follows.
1. Component attenuation
In the case of normal aging decay, the attenuation of the first year of the current component is about 1%, the attenuation of the component after the second year will show a linear change, and the attenuation rate of 30 years is about 13%, that is, the annual generating capacity of the component is declining, and the rated power output cannot be continuously maintained, so the design of the photovoltaic capacity ratio needs to take into account the attenuation of the component during the whole life cycle of the power station. To maximize the power generation of matched components and improve the system efficiency.
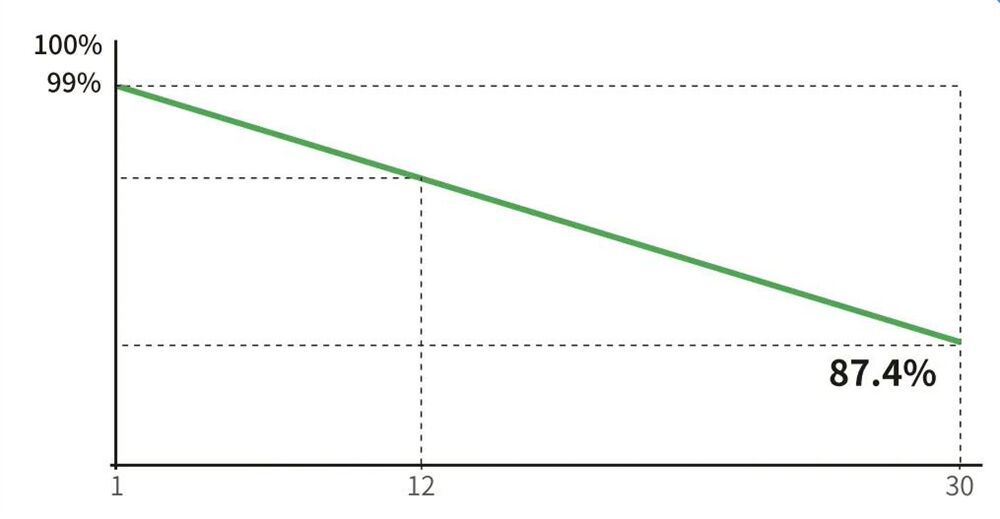 30-year linear power attenuation curve of photovoltaic modules
2. System loss
In the photovoltaic system, there are various losses between the photovoltaic module and the inverter output, including the module series and parallel and block dust loss, DC cable loss, photovoltaic inverter loss, etc., the loss of each link will affect the actual output power of the photovoltaic power plant inverter.
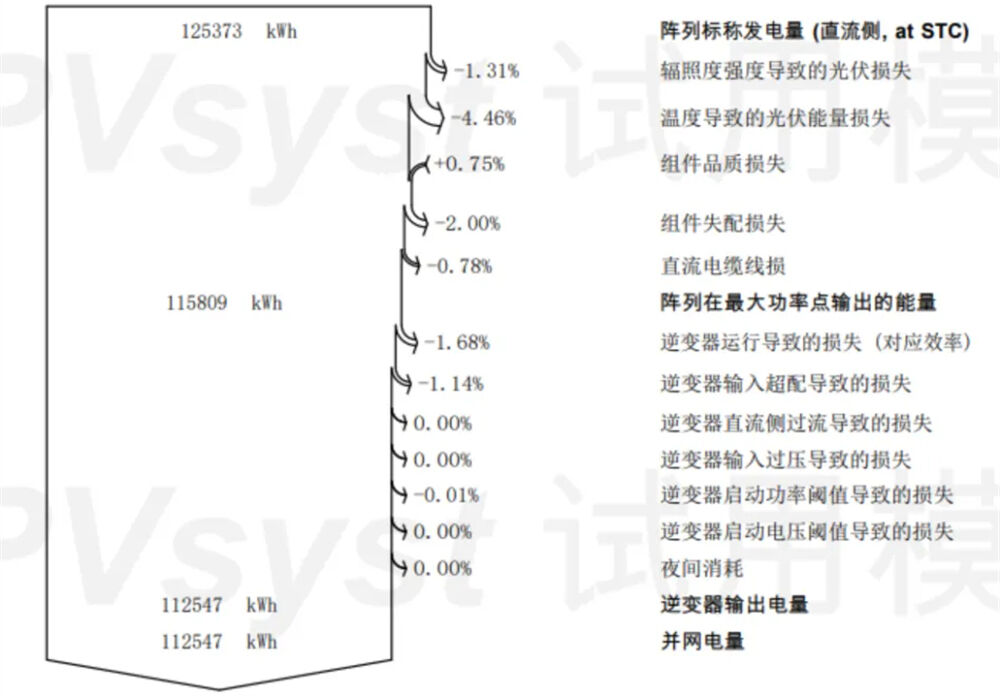
PVsyst PV power plant simulation report
As shown in the figure, the actual configuration and occlusion loss of the project can be simulated by PVsyst in the project application; Under normal circumstances, the DC loss of the photovoltaic system is about 7-12%, the inverter loss is about 1-2%, and the total loss is about 8-13%. Therefore, there is a loss deviation between the installed capacity of photovoltaic modules and the actual power generation data. If the installation capacity of the component is selected according to the 1:1 capacity ratio of the photovoltaic inverter, the actual output maximum capacity of the inverter is only about 90% of the rated capacity of the inverter, even when the light is best, the inverter is not fully loaded, reducing the utilization of the inverter and the system.
3. Irradiance varies in different regions
The component can only reach the rated power output under STC operating conditions (STC operating conditions: The light intensity is 1000W/m², the battery temperature is 25°C, and the atmospheric quality is 1.5), if the working conditions do not reach the STC conditions, the output power of the photovoltaic module is inevitably less than its rated power, and the time distribution of the light resources within a day can not all meet the STC conditions, mainly because the difference between early, middle and late irradiance and temperature is large; At the same time, the irradiance and environment of different regions have different effects on the power generation of photovoltaic modules, so the initial project needs to understand the local light resource data according to the specific region, and carry out data calculation.
According to the classification standards of the Wind and Solar Energy Evaluation Center of the National Weather Service, the specific data of irradiance in different regions can be learned, and the total annual solar radiation irradiation is divided into four grades:

Classification of total solar radiation annual irradiance
Therefore, even in the same resource area, there are great differences in the amount of radiation throughout the year. It means that the same system configuration, that is, the same capacity ratio under the power generation is not the same. In order to achieve the same power generation, it can be achieved by changing the volume ratio.
4. Component installation Angle
There will be different roof types in the same project for the user-side photovoltaic power station, and different component design angles will be involved according to different roof types, and the irradiance received by the corresponding components will also be different. For example, there are colored steel tile roofs and concrete roofs in an industrial and commercial project in Zhejiang Province, and the design inclination angles are 3° and 18° respectively. The irradiation data of inclined plane simulated by PV for different inclination angles are shown in the figure below. It can be seen that the irradiance received by the components installed at different angles is different. If the distributed roof is mostly tiled, the output energy of the components with the same capacity is lower than that of those with a certain inclination Angle.
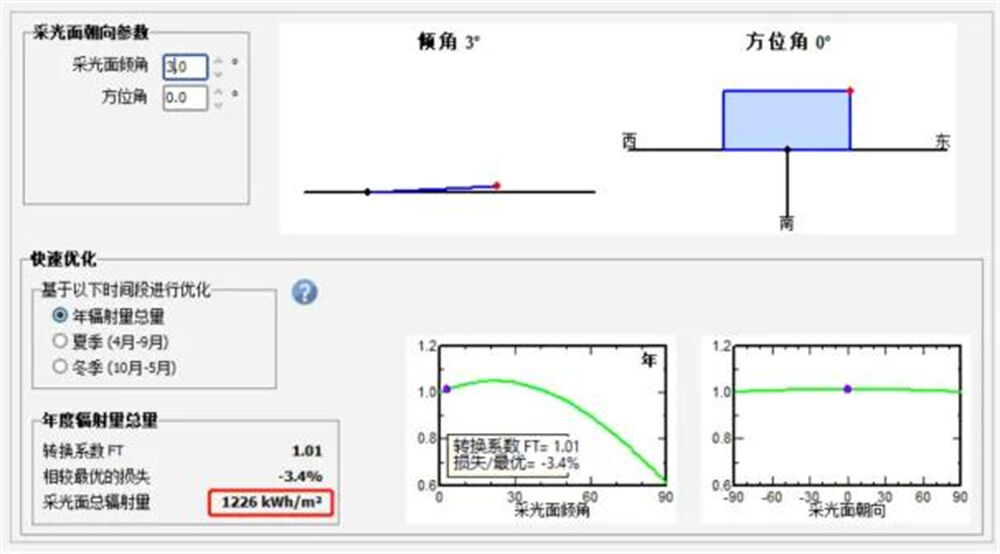
3° tilt Angle total radiation
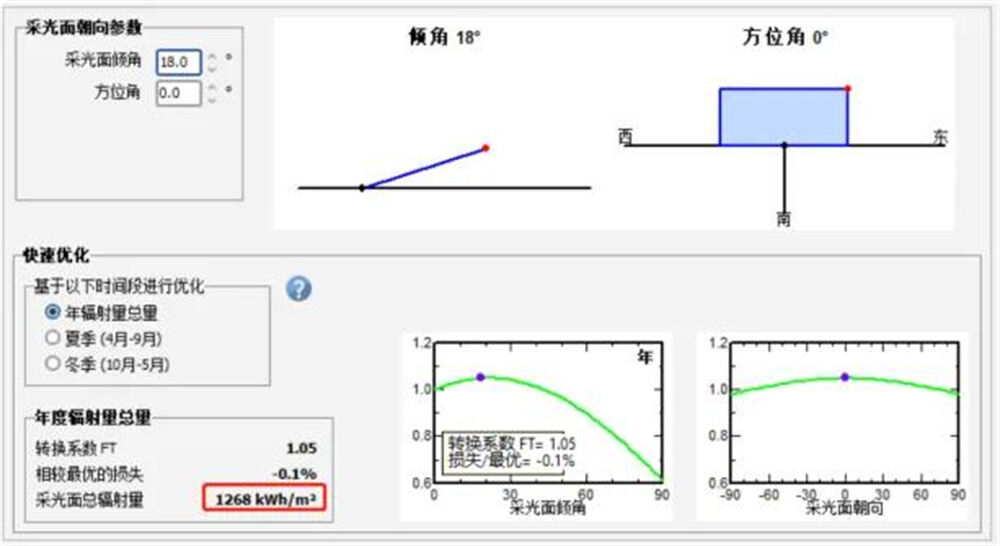
18° tilt Angle total radiation
03 Capacity ratio design ideas
According to the above analysis, the design of the capacity ratio is mainly to improve the overall benefit of the power station by adjusting the DC access capacity of the inverter. At present, the configuration methods of capacity ratio are mainly divided into compensatory overmatching and active overmatching.
1. Compensate for overmatching
Compensatory overmatching means that by adjusting the volume ratio, the inverter can reach full load output when the light is best. This method only takes into account the partial loss in the photovoltaic system, by increasing the capacity of the component (as shown in the figure below), can compensate the system loss of energy in the transmission process, so that the inverter in the actual use of the full load output effect, and no clipping loss.
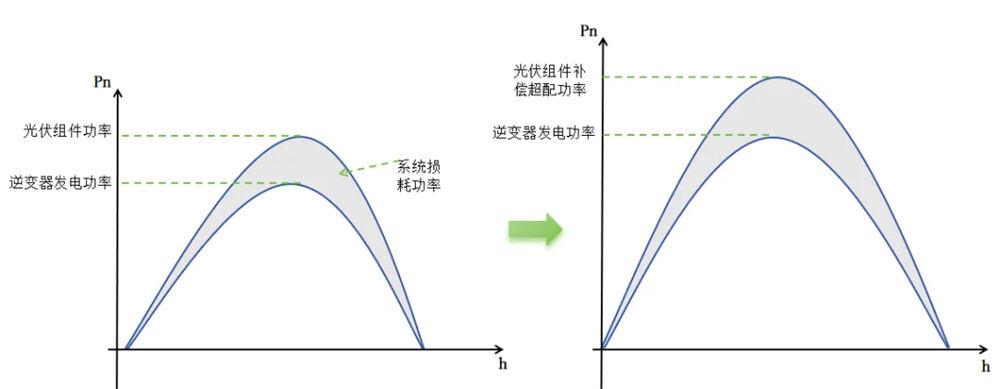
Compensation overmatch diagram
2. Active overmatching
Active overmatching is to continue to increase the capacity of photovoltaic modules on the basis of compensation overmatching (as shown in the figure below). This method not only considers the system loss, but also comprehensively considers the investment cost and income and other factors. The goal is to minimize the average power cost (LCOE) of the system by actively extending the inverter's full working time, finding a balance between the increased component input cost and the system's power generation income. Even in the case of poor lighting, the inverter also has full load work, thus extending the full load working time; However, the actual power generation curve of the system will appear the phenomenon of "peak clipping" as shown in the figure, and some time periods are in the working state of limited generation. However, under the appropriate capacity ratio, the LCOE of the system as a whole is the lowest, that is, the benefit is increased.
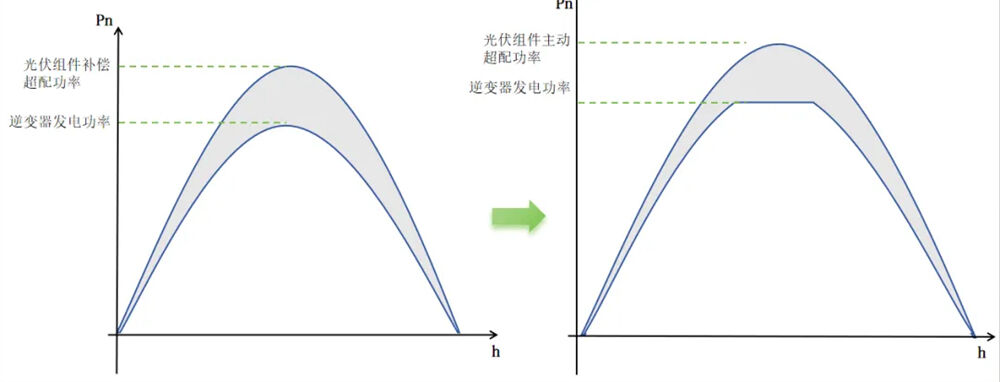
Active overmatching diagram
As shown in the figure below, LCOE continues to decline with the increase of the capacity ratio. At the compensatory excess ratio point, the LCOE of the system does not reach the lowest value. When the capacity ratio is further increased to the active excess ratio point, the LCOE of the system reaches the lowest value, and the LCOE will increase after the capacity ratio is further increased. Therefore, the active overmatching point is the optimal capacity ratio of the system.
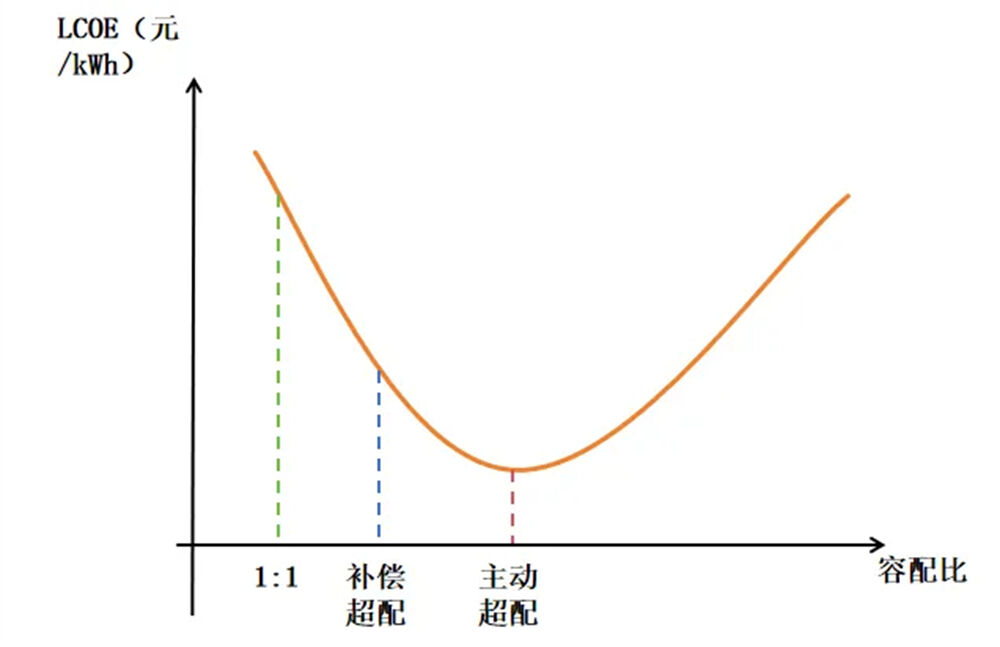
LOCE/ capacity ratio diagram
For inverters, how to meet the minimum LCOE of the system requires sufficient DC side overallocation capability to achieve, for different regions, especially for areas with poor irradiation conditions, a higher active overallocation scheme is required to extend the rated output time of the inverter and maximize the reduction of the LCOE of the system.
04 Conclusions and Suggestions
In summary, compensatory overallocation and active overallocation schemes are effective means to improve the efficiency of photovoltaic systems, but each has its own focus. Compensation overmatching mainly focuses on the compensation of system loss, while active overmatching pays more attention to finding a balance between increasing input and improving income. Therefore, in the actual project, it is recommended to comprehensively select the appropriate capacity ratio configuration scheme according to the project requirements.
Hot News
-
Meet ANBOSUNNY at RENWEX 2024
2024-06-18
-
Anbosunny Successfully Participated in Solar & Storage Live Philippines 2024
2024-05-23
-
Meet us at The Future Energy Show Philippines 2024
2024-05-16
-
Anbosunny Successfully Participated in Solar & Storage Live South Africa 2024
2024-03-22
-
Exciting News! Anbosunny to Showcase Cutting-Edge Home Energy Storage Solutions at Major Trade Shows in 2024
2024-03-18
-
The booming European home solar market: Opportunities for Chinese companies
2023-12-22
-
Ningbo Anbo Showcases Renewable Energy Innovations at Riyadh Solar & Future Energy Shows
2023-11-01

 EN
EN
 AR
AR
 BG
BG
 HR
HR
 CS
CS
 DA
DA
 NL
NL
 FI
FI
 FR
FR
 DE
DE
 EL
EL
 HI
HI
 IT
IT
 JA
JA
 KO
KO
 NO
NO
 PL
PL
 PT
PT
 RO
RO
 RU
RU
 ES
ES
 SV
SV
 TL
TL
 ID
ID
 UK
UK
 VI
VI
 TH
TH
 FA
FA
 AF
AF
 MS
MS
 BE
BE
 BN
BN
 LO
LO
 NE
NE
 MY
MY
 KK
KK
 SU
SU
 UZ
UZ
 KY
KY
 XH
XH


